
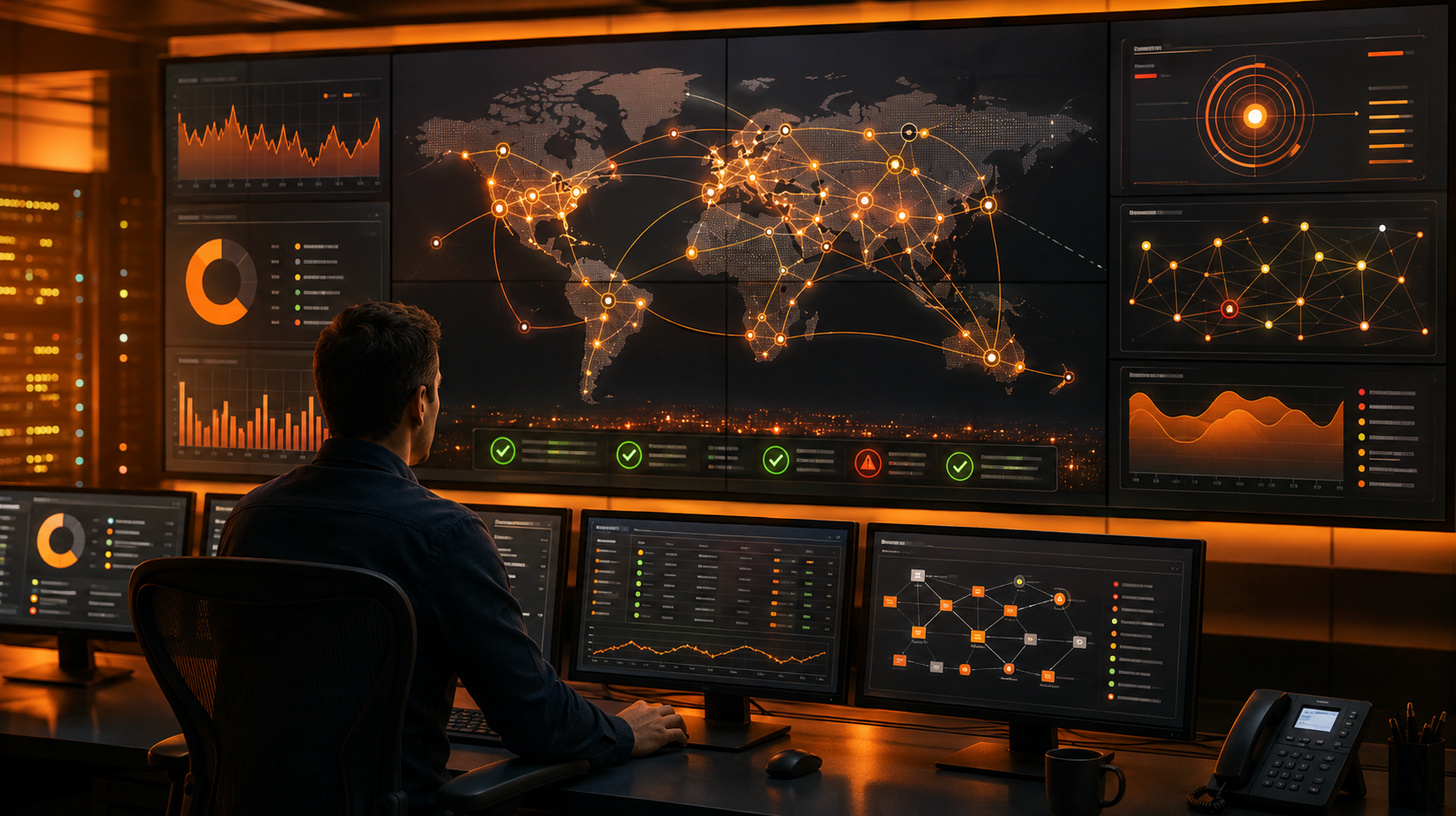
Proactive network monitoring is less about watching dashboards and more about noticing when the usual pattern begins to change. That might mean a rise in latency, unusual packet loss, an unexpected traffic shift, or a cluster of user reports that does not yet look serious on its own.
Experienced teams rarely rely on a single signal. They compare device health, application paths, cloud dependencies, provider information, and, where relevant, external reference points such as detector404 in Brazil to see whether an issue is isolated or part of something broader.
The best monitoring platforms make that comparison easier. Instead of producing another threshold alert, they help teams connect events, understand dependencies, and narrow down where a problem may be developing. Real-time data, anomaly detection, historical context, predictive analytics, and automation all matter, but only when they lead to a clearer decision. The practical goal is simple: identify trouble early enough to investigate it on your terms, rather than after users have already felt the impact.
1. Selector
Selector is built for complex environments that need AI-driven network observability. It brings metrics, logs, topology, events, configurations, and other operational data into one platform. Machine learning creates adaptive baselines, detects anomalies, and correlates signals across network, cloud, infrastructure, and applications.
Its operational twin maps dependencies, while Network DVR supports historical replay. Selector also provides AI-assisted root-cause analysis, forecasting, guided remediation, and a natural-language copilot.

Best for: enterprises that want less alert noise and more predictive operations.
2. SolarWinds Network Performance Monitor
SolarWinds Network Performance Monitor suits teams focused on devices, interfaces, paths, and hybrid connectivity. It discovers devices, tracks health and performance, builds topology views, and stores historical data.
NetPath shows hop-by-hop performance across on-premises, provider, cloud, and SaaS routes. PerfStack compares network, system, and application metrics on one timeline. Dependency-aware alerts reduce noise, while capacity forecasting supports proactive planning.
Best for: organizations that want self-hosted monitoring with strong path analysis.
3. Datadog Network Monitoring
Datadog fits cloud-native and hybrid environments where network behavior must be viewed with applications and infrastructure. Cloud Network Monitoring and Network Device Monitoring cover service traffic, physical and virtual devices, WANs, and multi-vendor networks.
Teams can use NetFlow for traffic analysis and Network Path for hop-by-hop troubleshooting. Shared observability data makes it easier to move from an application symptom to the network or device causing it.
Best for: teams that want one platform across the application and network stack.
4. Paessler PRTG Network Monitor
PRTG uses a sensor-based model to monitor devices, bandwidth, servers, applications, virtual systems, and cloud resources. It supports SNMP, WMI, flow protocols, packet sniffing, SSH, and other methods.
Auto-discovery, alerts, dashboards, reports, and maps make it flexible for mixed environments. Larger deployments need careful sensor planning and alert tuning.
Best for: teams that want broad, configurable monitoring in one platform.
5. Auvik Network Management
Auvik combines monitoring with automated network management. It discovers devices, maintains a live network map, tracks traffic, builds inventory, and automatically backs up supported device configurations.

Its AI-guided troubleshooting analyzes network data and suggests likely root causes. This suits lean IT teams and managed service providers that want fast visibility without a heavy monitoring stack.
Best for: MSPs and distributed IT teams that value automation and quick troubleshooting.
How to choose the right solution
The right monitoring setup depends less on the number of features and more on where your team needs visibility. Selector focuses heavily on AI-driven correlation and predictive analysis, SolarWinds on device and path monitoring, Datadog on cloud and application telemetry, PRTG on broad sensor-based coverage, and Auvik on automated network management.
No single tool has to answer every question during an incident. Internal monitoring platforms are typically used to understand what is happening across devices, links, applications, and dependencies, while other sources can help establish whether the problem extends beyond that environment. A team investigating a service disruption might compare its own telemetry with a provider status page, regional reports through detector404.com.br in Brazil, or other independent signals before deciding where to investigate next.
This makes interoperability and context just as important as raw monitoring depth. Look for a platform that gives engineers useful alerts, historical data, topology awareness, and enough flexibility to fit into the wider troubleshooting workflow rather than forcing every investigation through a single source.